MAT Memory Analyzer Tool 基本使用
简介
分析和理解我们应用中内存的分布是一件极具挑战的事情。一个逻辑错误就有可能导致OutOfMemory。dump内存的方式很单:jmap -dump:format=b,file=path pid
注意操作时要有正确的用户权限。本篇旨在介绍分析中涉及到的一些概念和操作方法,实际案例分析放在下篇介绍。
内存泄漏指由于疏忽或错误造成程序未能释放已经不再使用的内存。内存泄漏并非指内存在物理上的消失,而是应用程序分配某段内存后,由于设计错误,导致在释放该段内存之前就失去了对该段内存的控制,从而造成了内存的浪费。
Histogram
当我们用MAT工具(用的eclipse插件)打开dump文件,MAT首先给我们一个应用占用内存的预览。
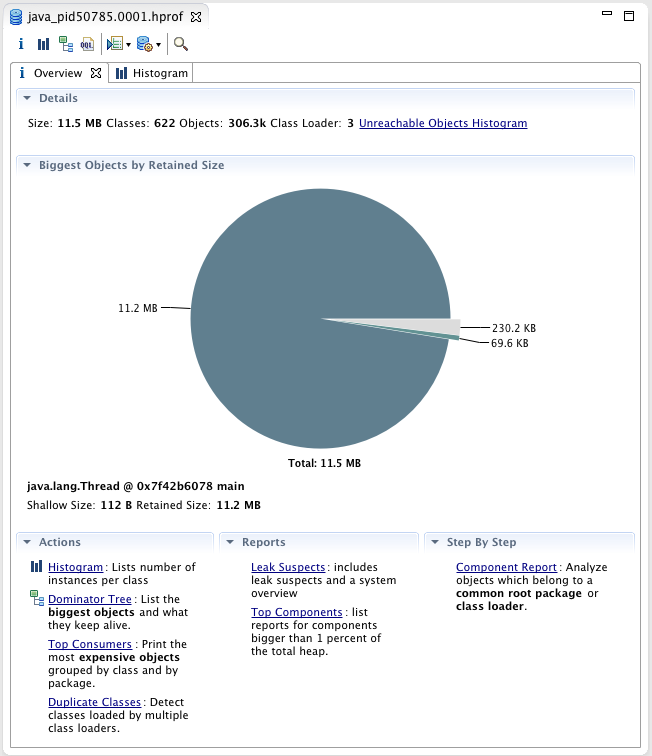
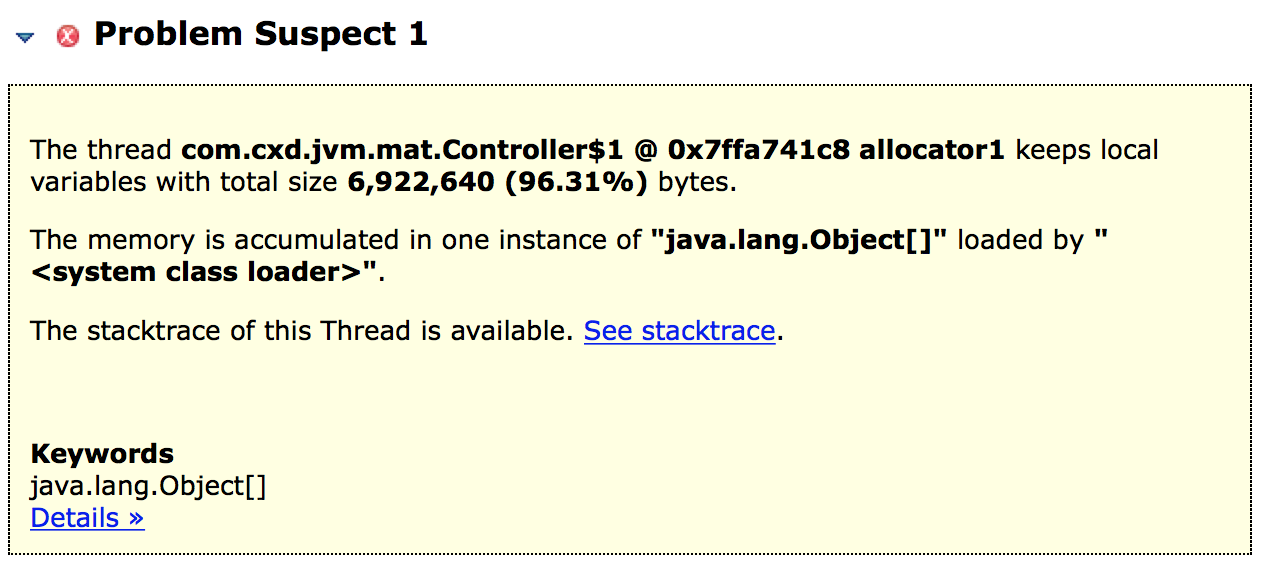
中间的饼图像我们直观展示了retained size最大的对象。这意味着如果可以处理好com.cxd.jvm.mat.Controller$1 @ 0x7ffa741c8 allocator1 这个对象,我们可以腾出6.6M的内存,它占用了应用总内存的90%以上。进一步查看这个对象的一些信息我们可以使用Histogram。
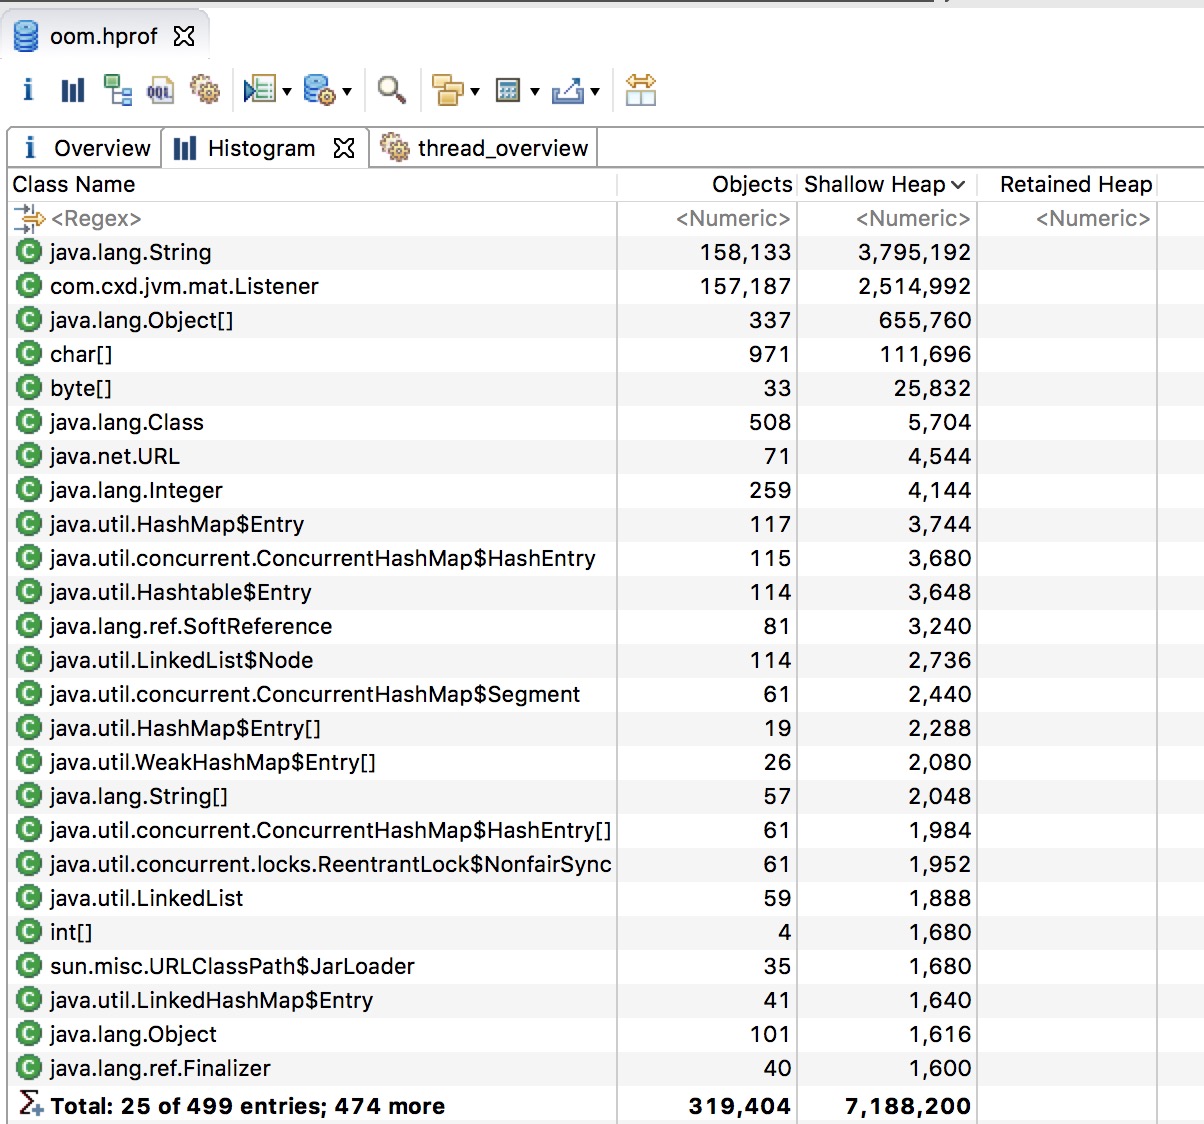
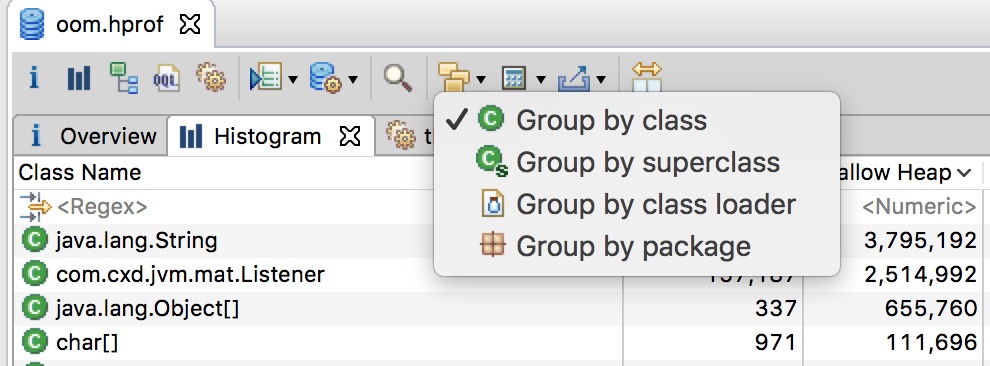
这个Histogram被实例化类的名字,数量,占用的内存,默认按照内存占用降序。像char[],String,Object[]这些看不出来有什么问题,为了更好的组织Histogram,我们可以按照包或者classLoader分组查看。
直方图还可以使用正则表达式过滤,例如我们只关心自己包下的类:.*com.cxd.jvm.*
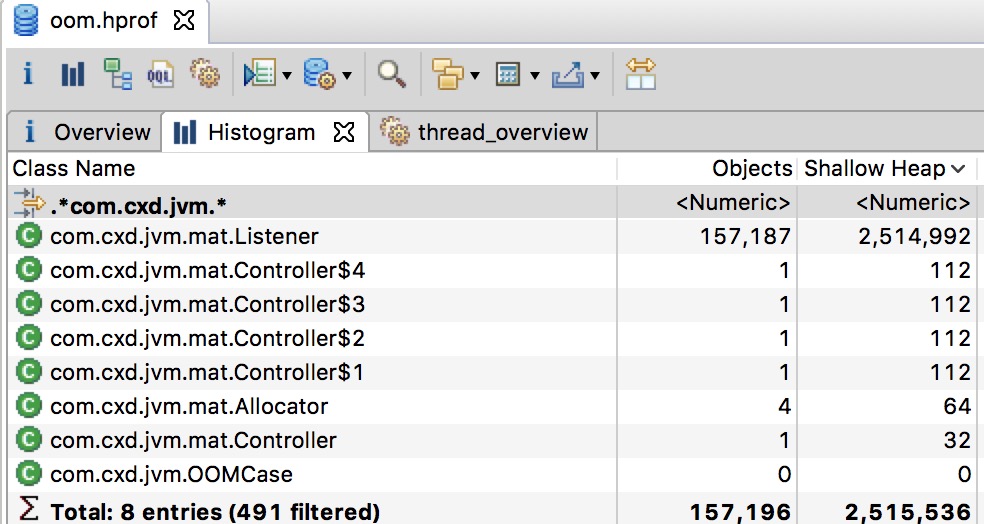
过滤后,清楚的看到有超过15W的Listener实例存活在应用中。同时我们看到了每个对象对内存的使用情况。有两个维度的计算,Shallow Heap 和 Retained Heap。Shallow Heap是一个对象持有引用占用的内存,并不包含其引用对象所占用的内存,可以理解成对象本身的大小,Shallow Heap对实际分析没有多大用处。常规对象(非数组)的Shallow Size由其成员变量的数量和类型决定。数组的Shallow Size由数组元素的类型(对象类型、基本类型)和数组长度决定。
1 | //"Shallow size" of this obj == 24 Bytes |
Retained Heap
Retained Heap是一个对象被GC回收时,能够释放其所有引用的Shallow Heap的总和。比如:一个ArrayList持有100,000个元素并且所有元素仅被这个ArrayList持有,每个元素16bytes,那么当该ArrayList被GC后将会释放16 x 100,000 + X,X是ArrayList的Shallow Heap。
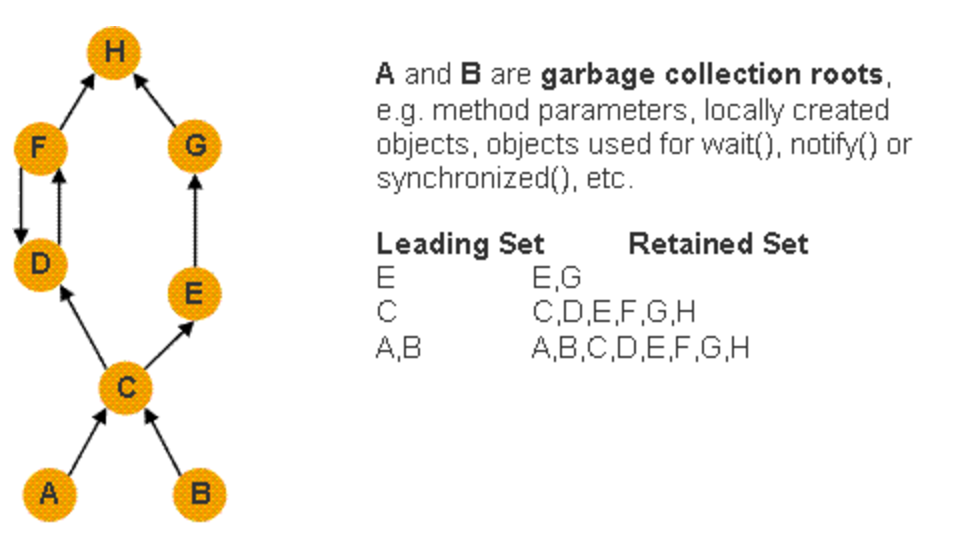
Retained Heap是Retained Set中所有对象大小的总和,一个对象的Retained Set是当该对象被GC后所要释放对象的集合。
Retained Heap有两种计算方式,一种是quick approximation(快速近似),一种是precise retained size(精确计算)。
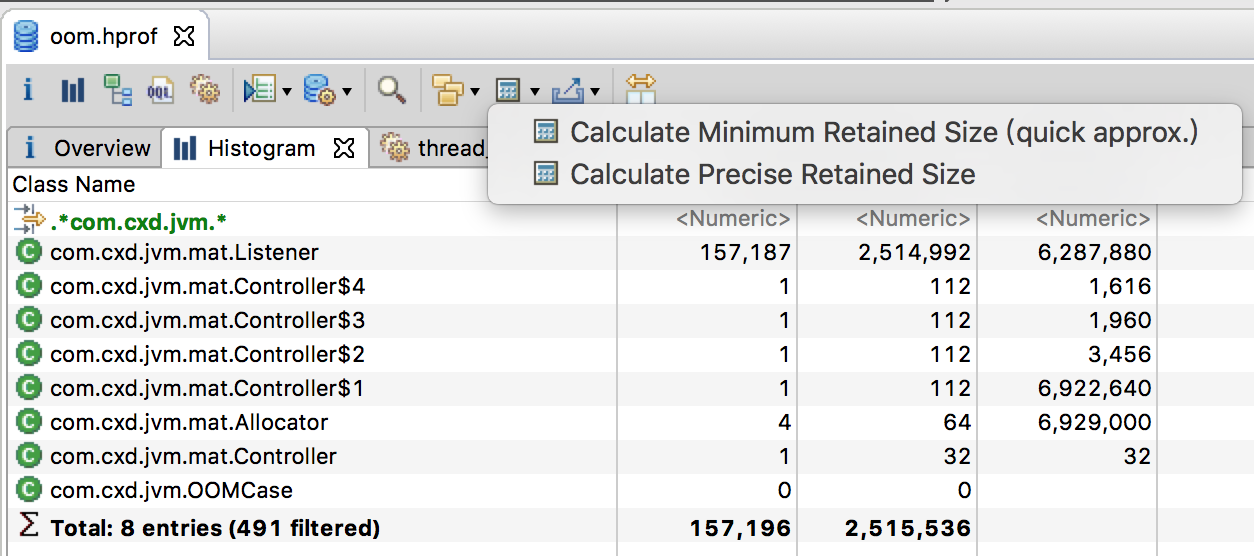
通过精确计算可以看到各个Allocator占用了太多的内存,虽然它的Shallow Heap只有64bytes。那么我们只要管控好Controller,内存也就得到了控制。
Dominator Tree
Dominator Tree由对象的引用图转换而来,它可以让我们清楚的看出大块内存消耗和对象间的依赖保活关系。在对象图中,如果从某个节点(或者根节点)开始到达Y的路径都要经过X,那么X Dominator Y。另外,如果X是路径最短的Dominator,那么X Immediate Dominator Y。
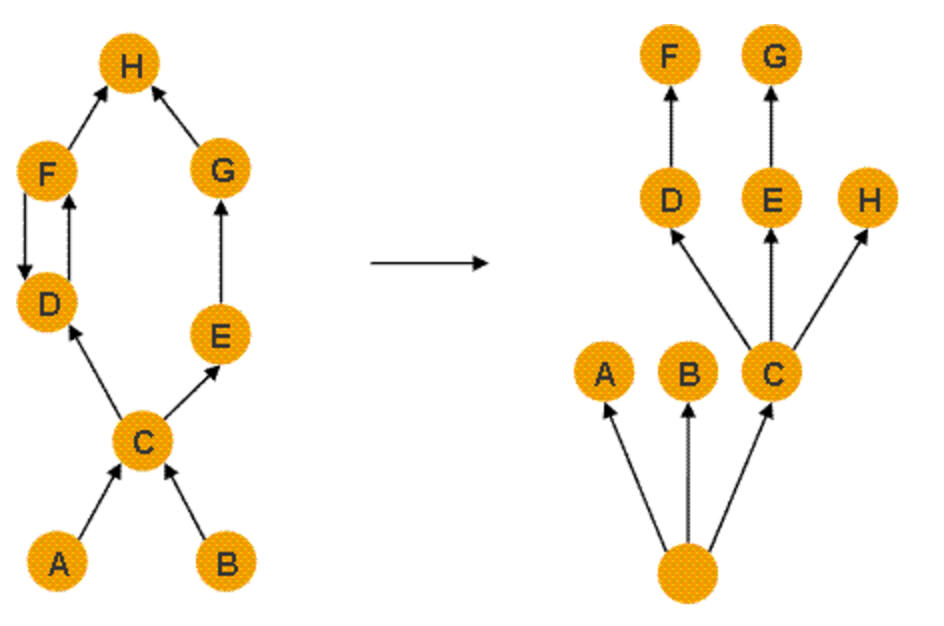
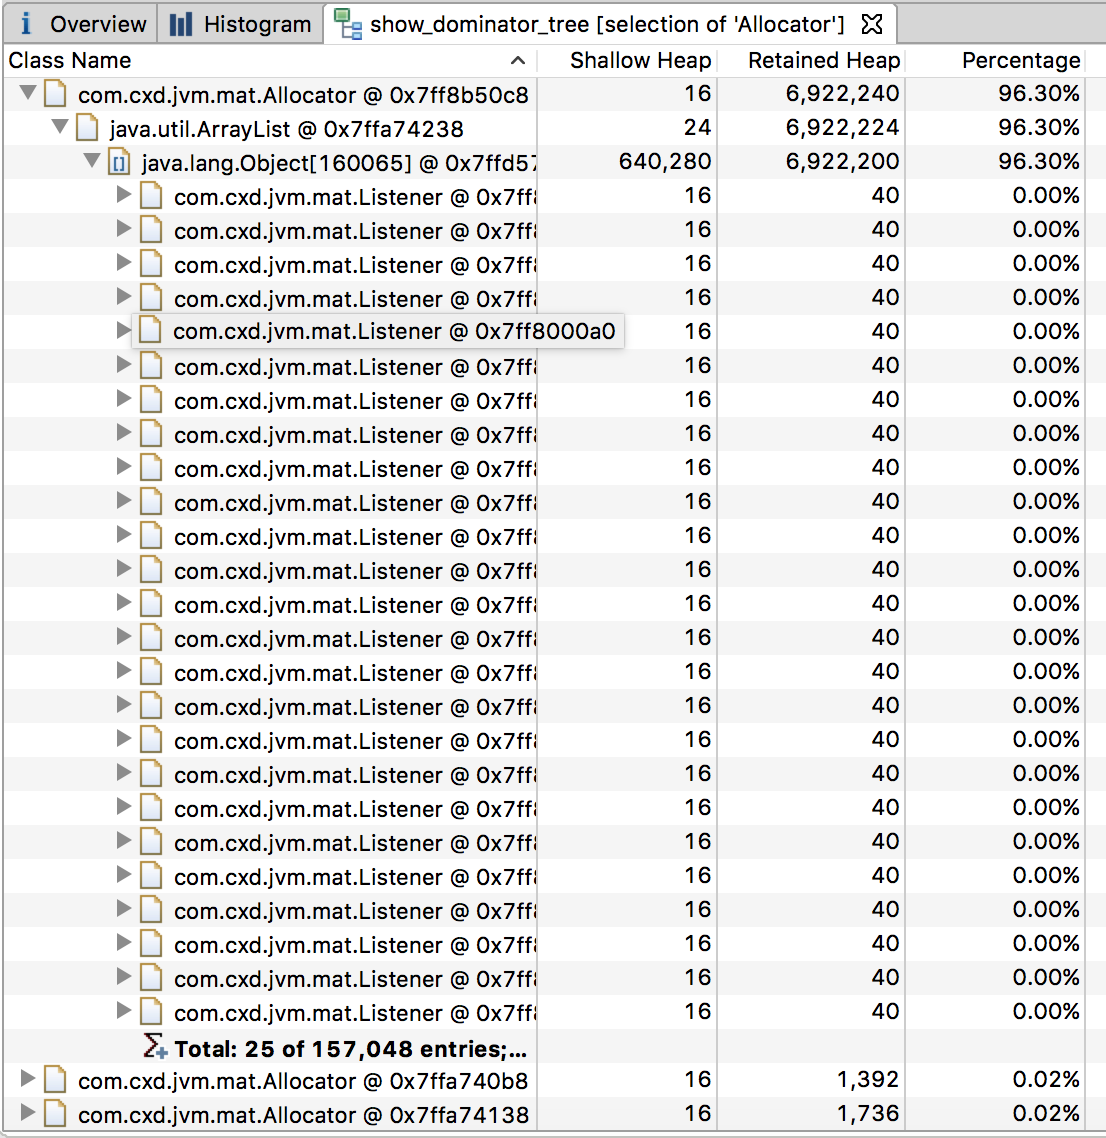
通过Dominator来分析我们的项目。
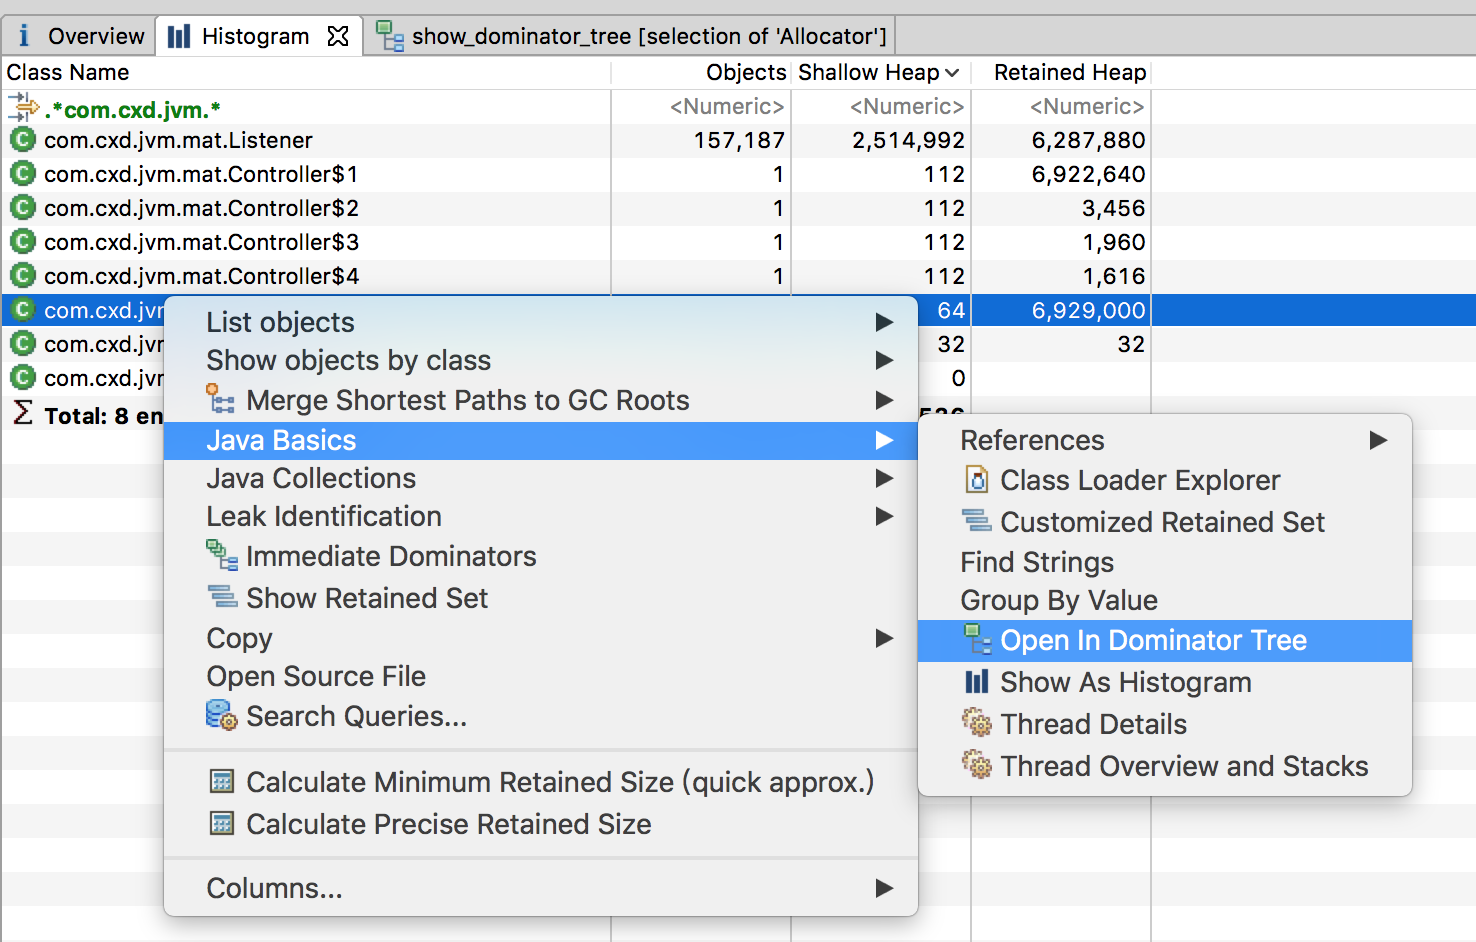
我们可以明确的看到Allocator便是罪魁祸首,它下面的ArrayList持有大量Listener。
The objects belonging to the sub-tree of x (i.e. the objects dominated by x ) represent the retained set of x .
If x is the immediate dominator of y , then the immediate dominator of x also dominates y , and so on.
The edges in the dominator tree do not directly correspond to object references from the object graph.
注意:
- 一个对象是X的子树(即:X Dominator 这个对象),那么,这个对象在X的retained set中;
- 如果X(Allocator) immediate dominator Y(Listener),那么,X的dominator(Controller)也dominator Y。换句话说,dominator具有向上传递性。
- The edges in the dominator tree do not directly correspond to object references from the object graph.(dominator tree中的边不直接对应于对象图中的对象引用)
Path to GC Roots
Dominator Tree对我们分析有帮助,但是它是向上找的一个过程,我们并不能知道Dominator的Dominator。Path to GC Roots这时候对我们会很有帮助。实操中需要结合使用。
我们看下例子中Listener的GC Root:
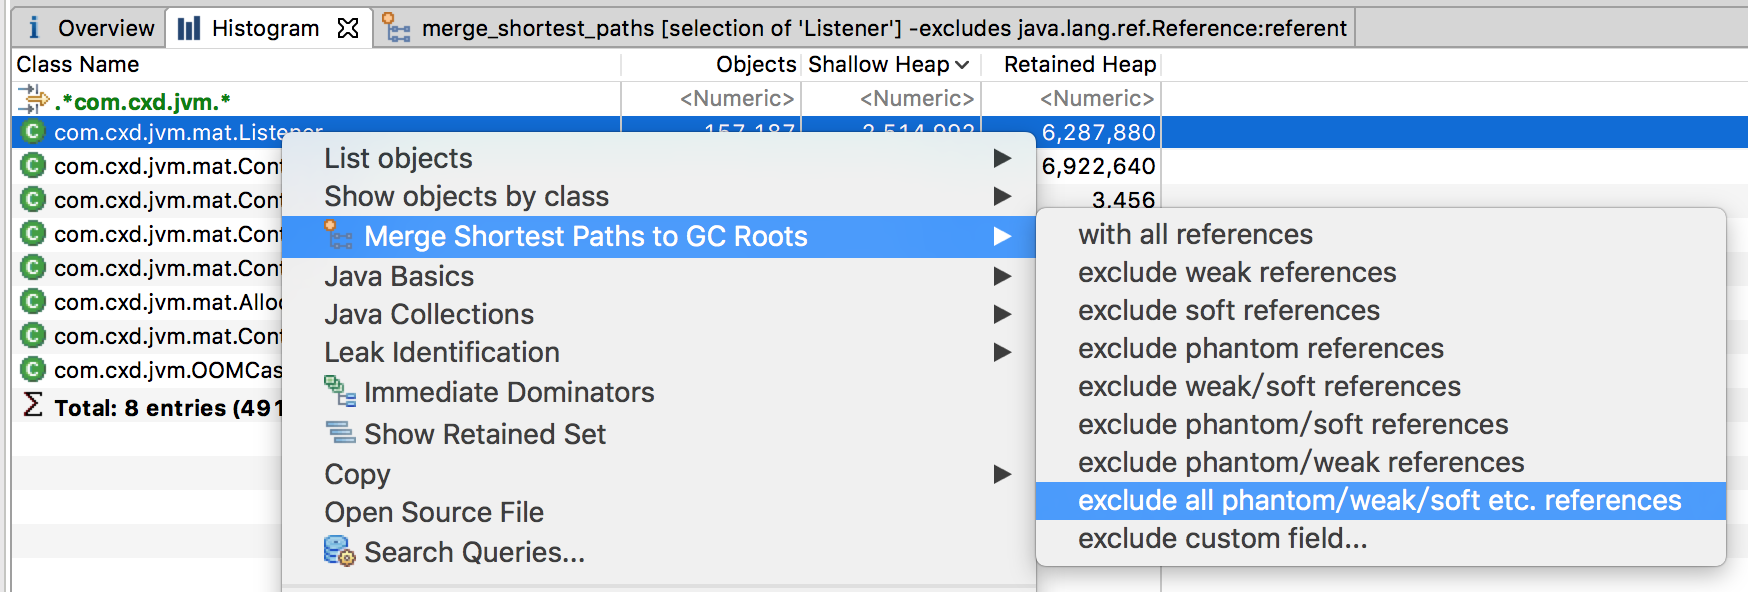
通常在排查内存泄漏的时候,我们会选择exclude all phantom/weak/soft etc.references,意思是:查看排除虚引用/弱引用/软引用等的引用链。因为这些引用的对象可以直接被GC给回收,我们要看的就是某个对象否还存在Strong引用链(在导出HeapDump之前要手动出发GC来保证),如果有,则说明可能存在内存泄漏,然后再去排查具体引用。
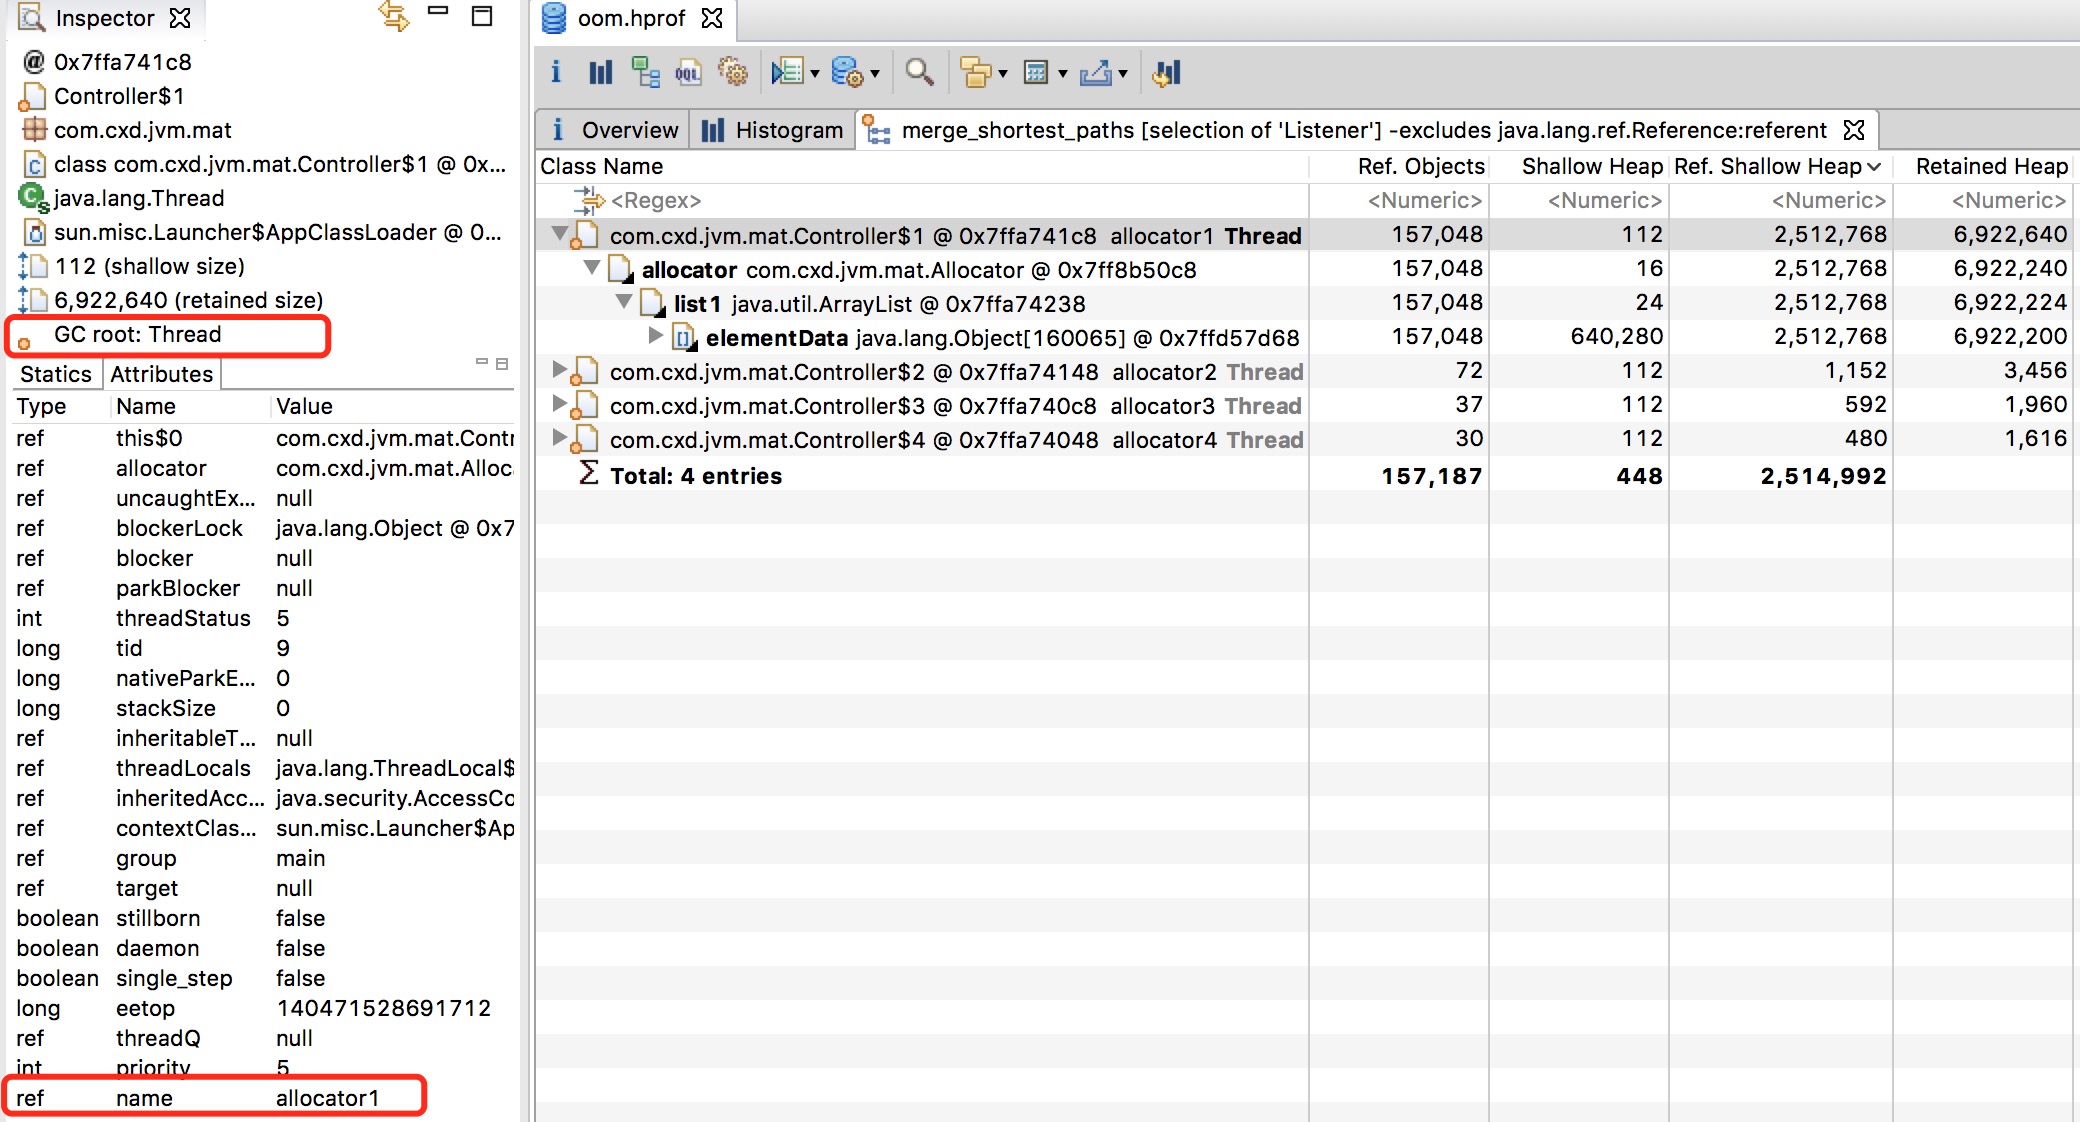
查看的时候要和左边框中的一些信息结合起来,他提供了更加详细的介绍。
GC Root 定义如下(官网摘录):
A garbage collection root is an object that is accessible from outside the heap. The following reasons make an object a GC root:
System Class
Class loaded by bootstrap/system class loader. For example, everything from the rt.jar like java.util.* .JNI Local
Local variable in native code, such as user defined JNI code or JVM internal code.JNI Global
Global variable in native code, such as user defined JNI code or JVM internal code.Thread Block
Object referred to from a currently active thread block.Thread
A started, but not stopped, thread.Busy Monitor
Everything that has called wait() or notify() or that is synchronized. For example, by calling synchronized(Object) or by entering a synchronized method. Static method means class, non-static method means object.Java Local
Local variable. For example, input parameters or locally created objects of methods that are still in the stack of a thread.Native Stack
In or out parameters in native code, such as user defined JNI code or JVM internal code. This is often the case as many methods have native parts and the objects handled as method parameters become GC roots. For example, parameters used for file/network I/O methods or reflection.Finalizable
An object which is in a queue awaiting its finalizer to be run.Unfinalized
An object which has a finalize method, but has not been finalized and is not yet on the finalizer queue.Unreachable
An object which is unreachable from any other root, but has been marked as a root by MAT to retain objects which otherwise would not be included in the analysis.Java Stack Frame
A Java stack frame, holding local variables. Only generated when the dump is parsed with the preference set to treat Java stack frames as objects.Unknown
An object of unknown root type. Some dumps, such as IBM Portable Heap Dump files, do not have root information. For these dumps the MAT parser marks objects which are have no inbound references or are unreachable from any other root as roots of this type. This ensures that MAT retains all the objects in the dump.
List Object
List objects with (以Dominator Tree的方式查看)
incoming references 引用到该对象的对象
outcoming references 被该对象引用的对象
Show objects by class (以class的方式查看)
incoming references 引用到该对象的对象
outcoming references 被该对象引用的对象
Common Memory Anti-Patterns
MAT使用Anti-Patterns给我们提供报告。这些报告对我们排查内存泄漏、优化low hanging fruit非常有帮助。
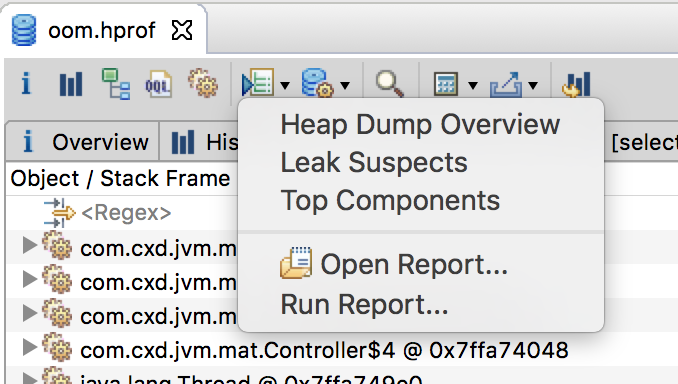
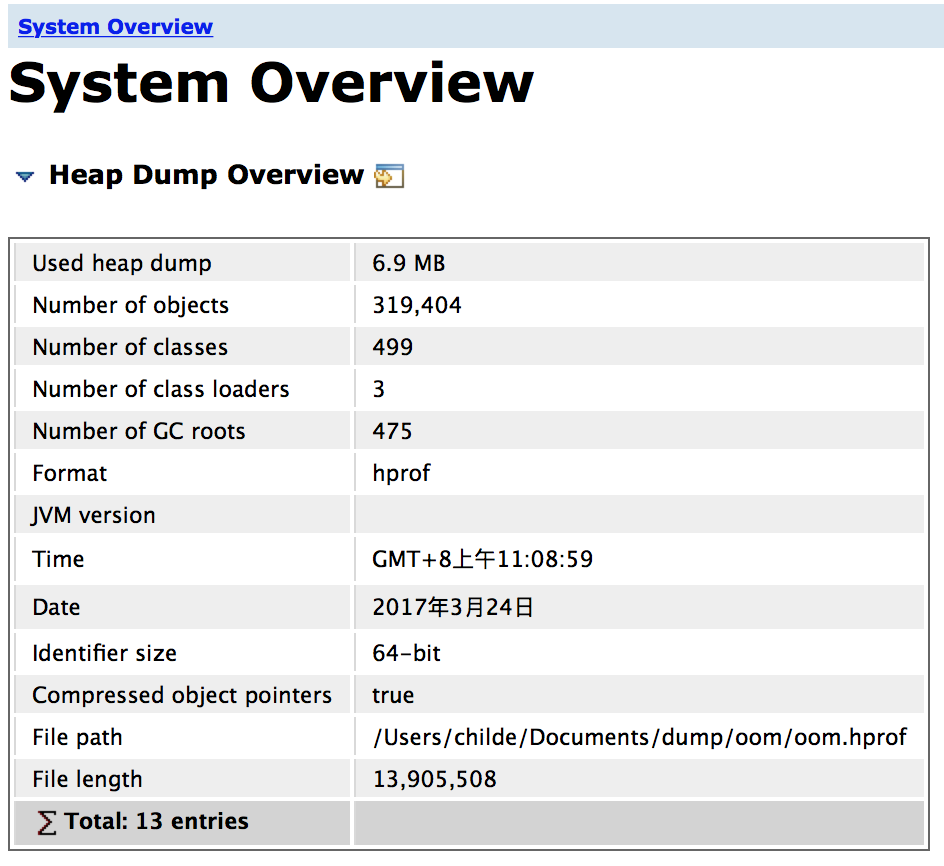
Heap Dump Overview给我们提供了系统属性、内存消耗排行等信息
Leak Suspects分析出可能存在的内存泄漏,供我们参考,通常这个功能可以帮我们直接找到问题所在
Java Collections
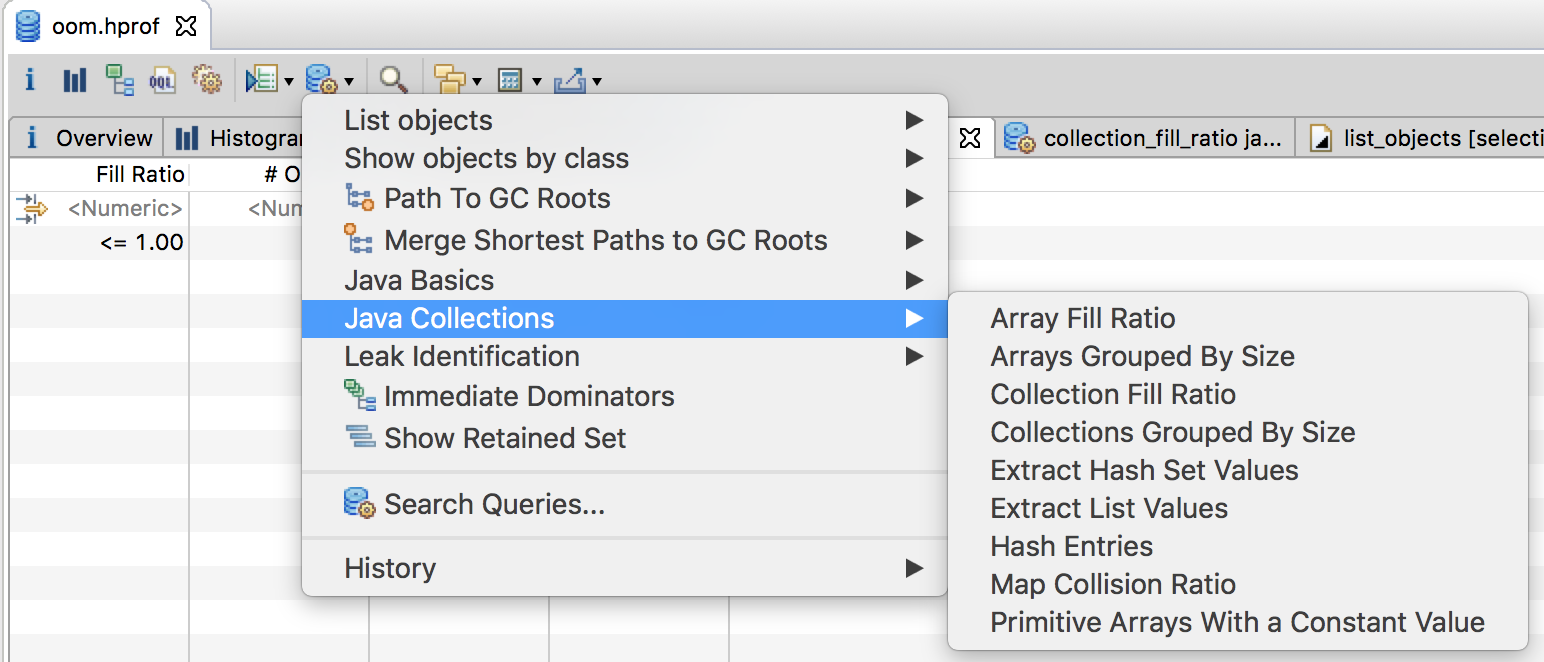
我们可以通过Java Collections查看Map Collision Ratio(Map碰撞比率=碰撞的实体/Hash表中所有实体)、Collection Fill Ratio(集合填充率=size/capacity)、Array Fill Ratio(集合填充率)。但这种方式只能查看那些具有预分配内存能力的集合。
填充率可以作为优化的一个参考,ArrayList填充率低说明我们当初对List的初始化大小预估有误,或者HashMap的冲突较大就说明我们的Key选的有问题或者hash算法需要改进等。
我们还可以通过Java Collections->Hash Entries查看key value。

Threads and Stacks
dump出的文件包含了JVM运行时的所有信息,当然MAT也就可以帮我们分析出其中的线程和栈信息。
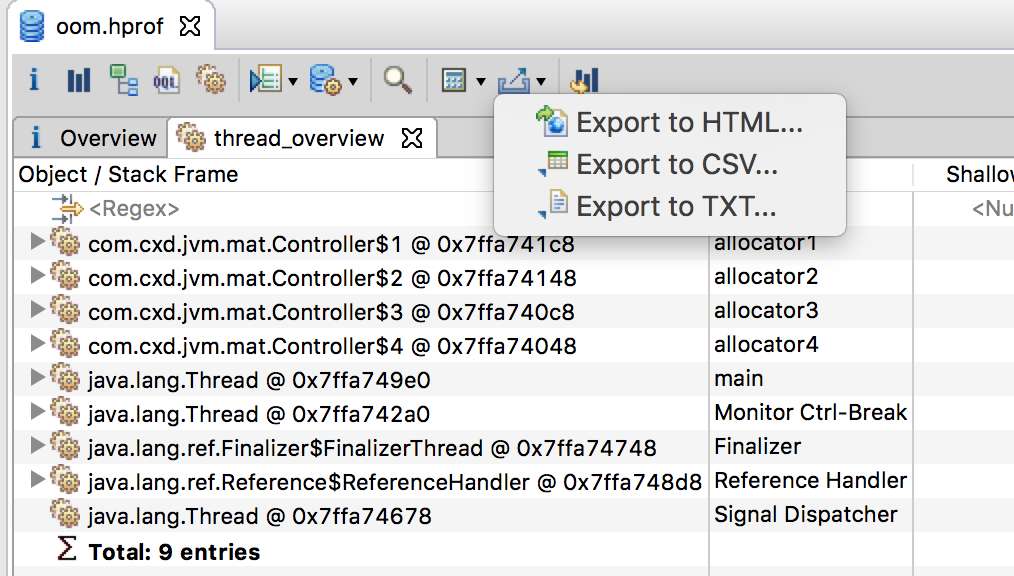
Exporting your results
在我们分析完成之后,可以将我们的分析导出,分享给大家。导出有三种格式:html、cvs、txt。
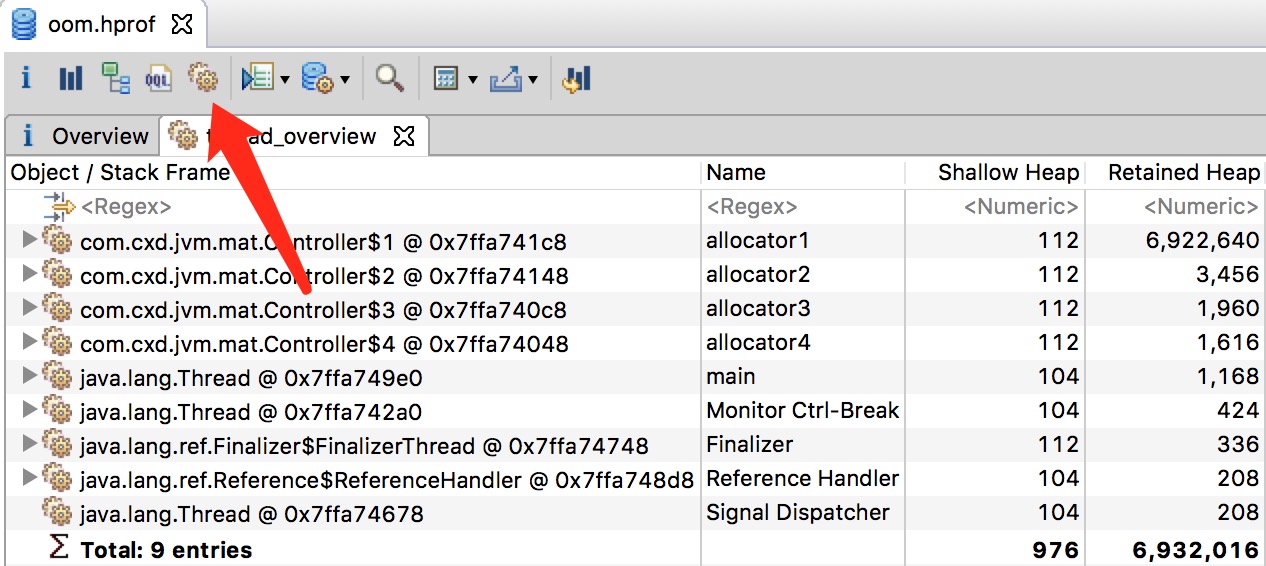
注意:导出的内容是你当前打开的分析窗口,如果你当前MAT没有任何分析窗口,导出的文件便为空。比如:下图中,我导出的内容就只有线程概览。
Object Query Language
TODO 单独一篇来讲
小生不才,以上如有描述有误的地方还望各位不吝赐教 !^_^!
参考整理自http://eclipsesource.com/blogs/2013/01/21/10-tips-for-using-the-eclipse-memory-analyzer/